
tmf / @doodle/dlog js
Repository URL to install this package:
|
Version:
1.2.0 ▾
|
| app |
| Jenkinsfile |
| package.json |
| README.md |
dlog
A small utility tool to parse and print our JSON logs into a more human-readable format. Works with spring-boot microservices in the Doodle ecosystem.
Installation
- Make sure you have the latest version of
nodeinstalled and you have at least read access to Doodle's NPM registry. The instructions are here. - Install the tool globally:
npm i -g @doodle/dlog
Usage
The tool consumes JSON from the standard input, formats it and prints the message to the standard output. So all you need to do is to pipe the output from k logs to dlog:
$ k logs -f <POD_NAME> | dlog
You can simplify things by adding an alias in your bash, for example, for ZSH, you need to add the following lines to your .zshrc file:
k_dlogs() {
  k logs -f $1 | dlog
}

alias kdlog="k_dlogs"
Don't forget to source ~/.zshrc after editing it.
Then you can call it from anywhere: kdlog <POD_NAME>. For example: kdlog svc-user-segmentation-0.
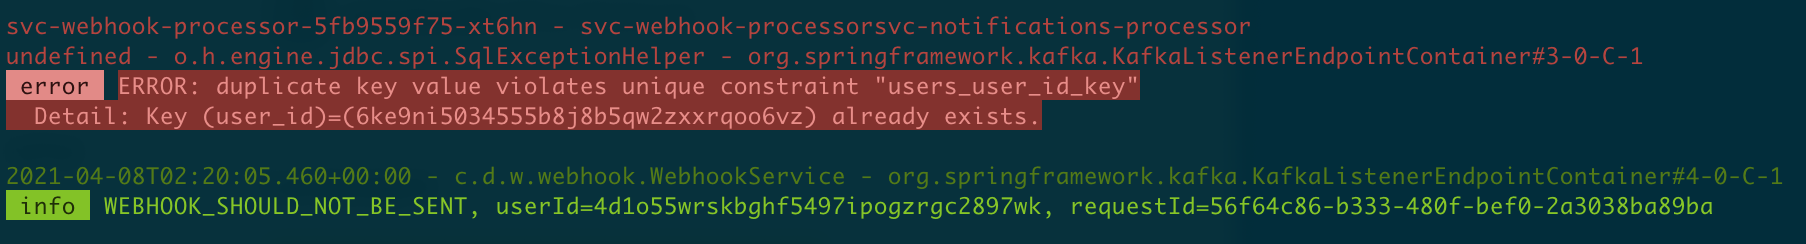
Together with stern
With stern you can use this tool easily by writing simple commands like:
stern webhook | dlog
and you will get output like:
Options
In case you need to watch the logs in real time and you are interested in a log level different from the one configurared in the app, you can override it by setting the DOODLE_DLOG_LOG_LEVEL environment variable to trace, debug, info, warn, or error.
For example, if you set DOODLE_DLOG_LOG_LEVEL to warn, only warnings and errors will be displayed for you. This helps with real-time debugging.
:bulb: Note that if you pass the --logLevel option to dlog, it will overwrite the value you supplied via DOODLE_DLOG_LOG_LEVEL
Flags
The following flags/options can be used to configure dlog:
Examples
$ dlog --local
$ dlog --local=true
$ dlog --logLevel=error
$ dlog --logLevel=error --utc
$ dlog --include="foo" --include="bar"